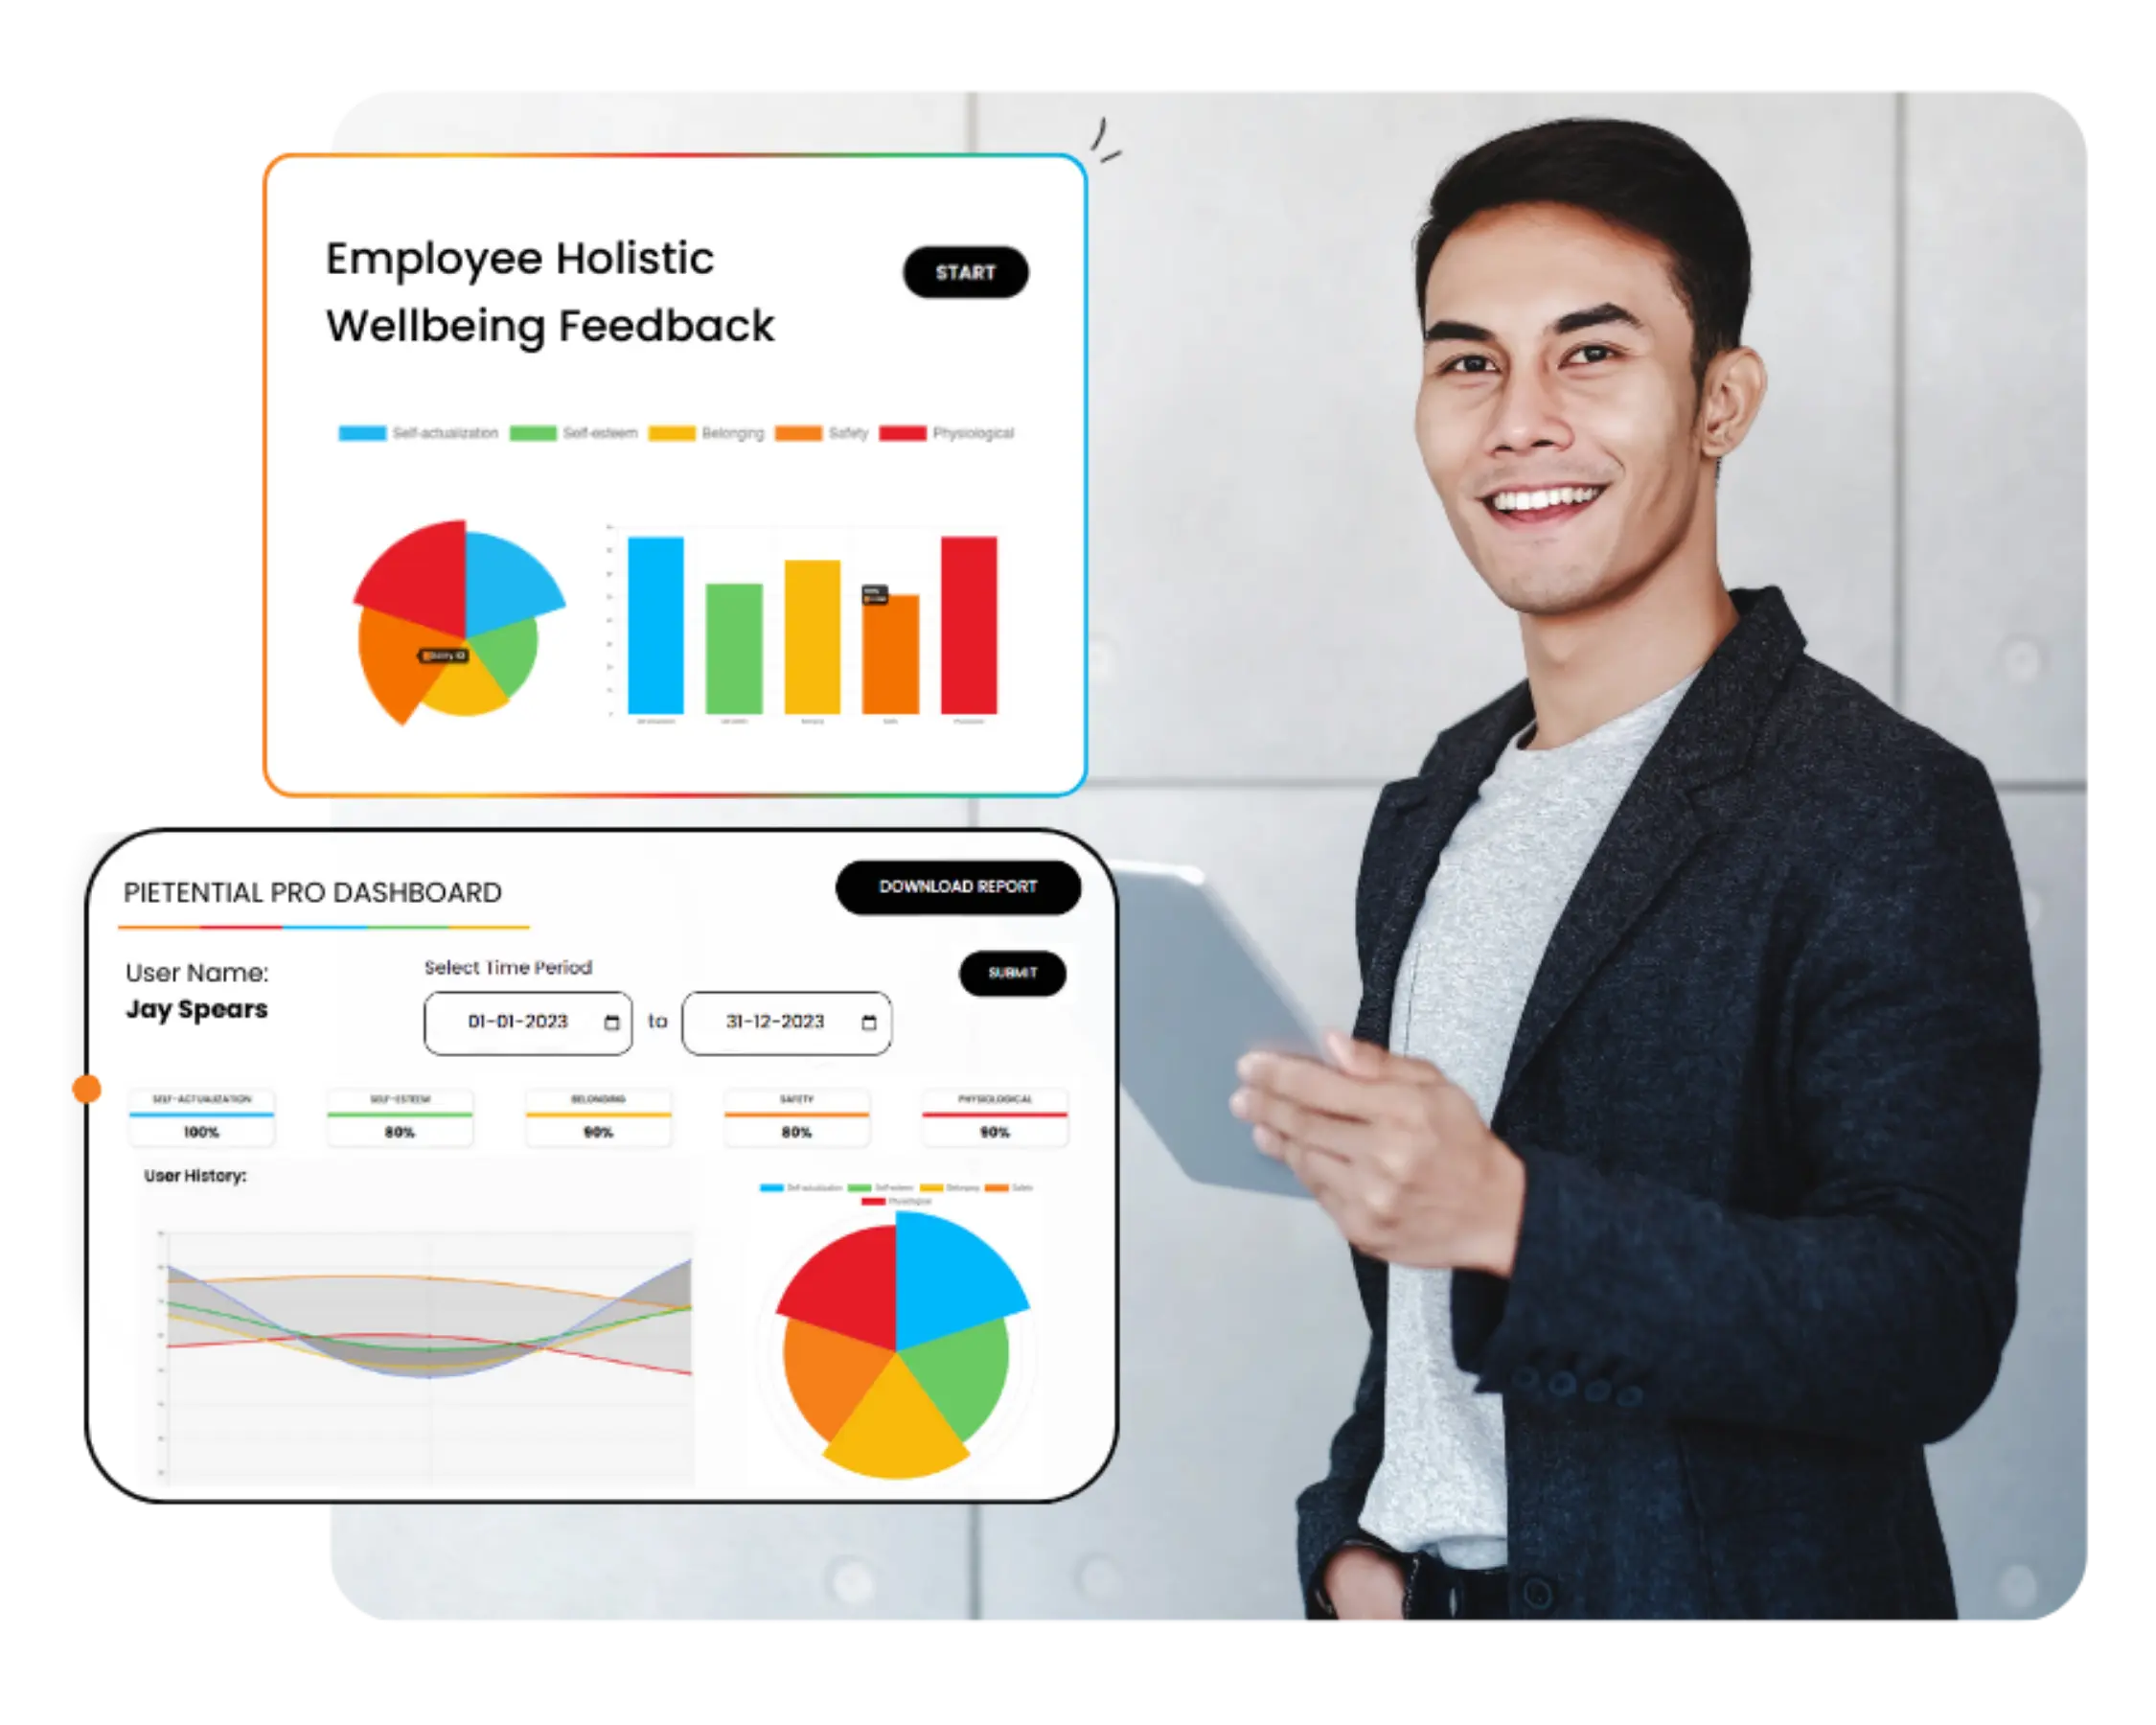
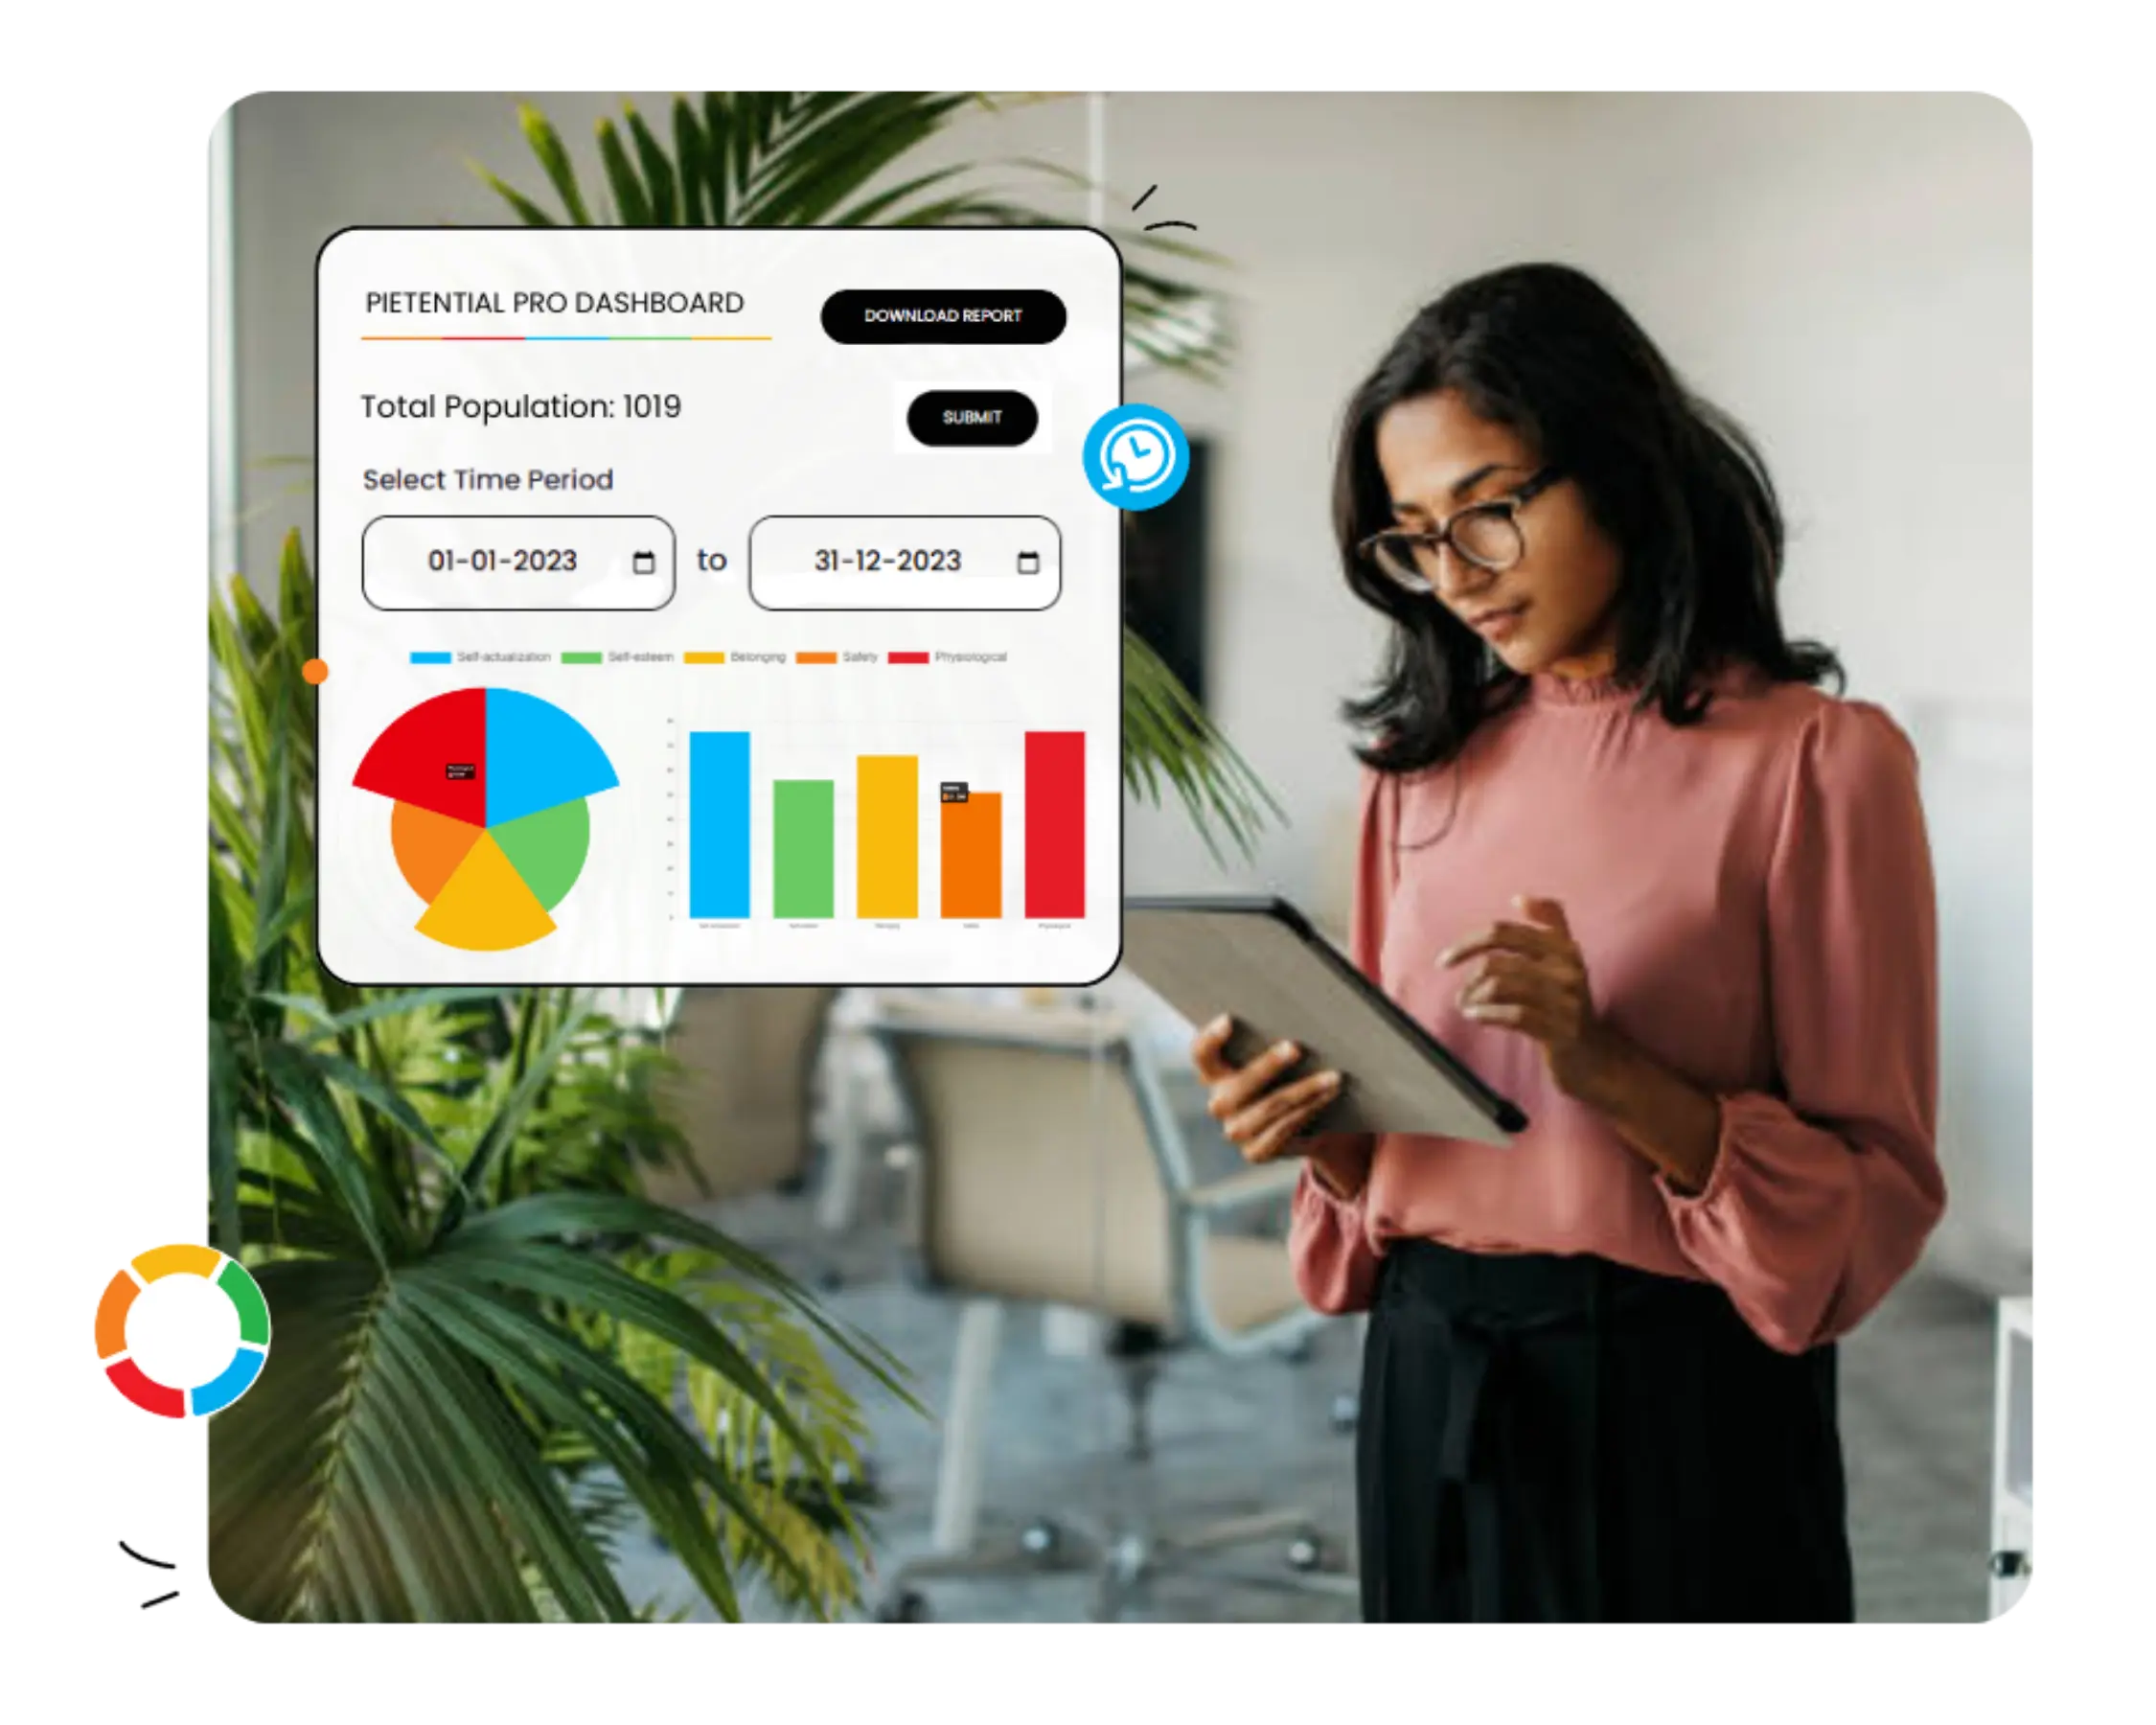
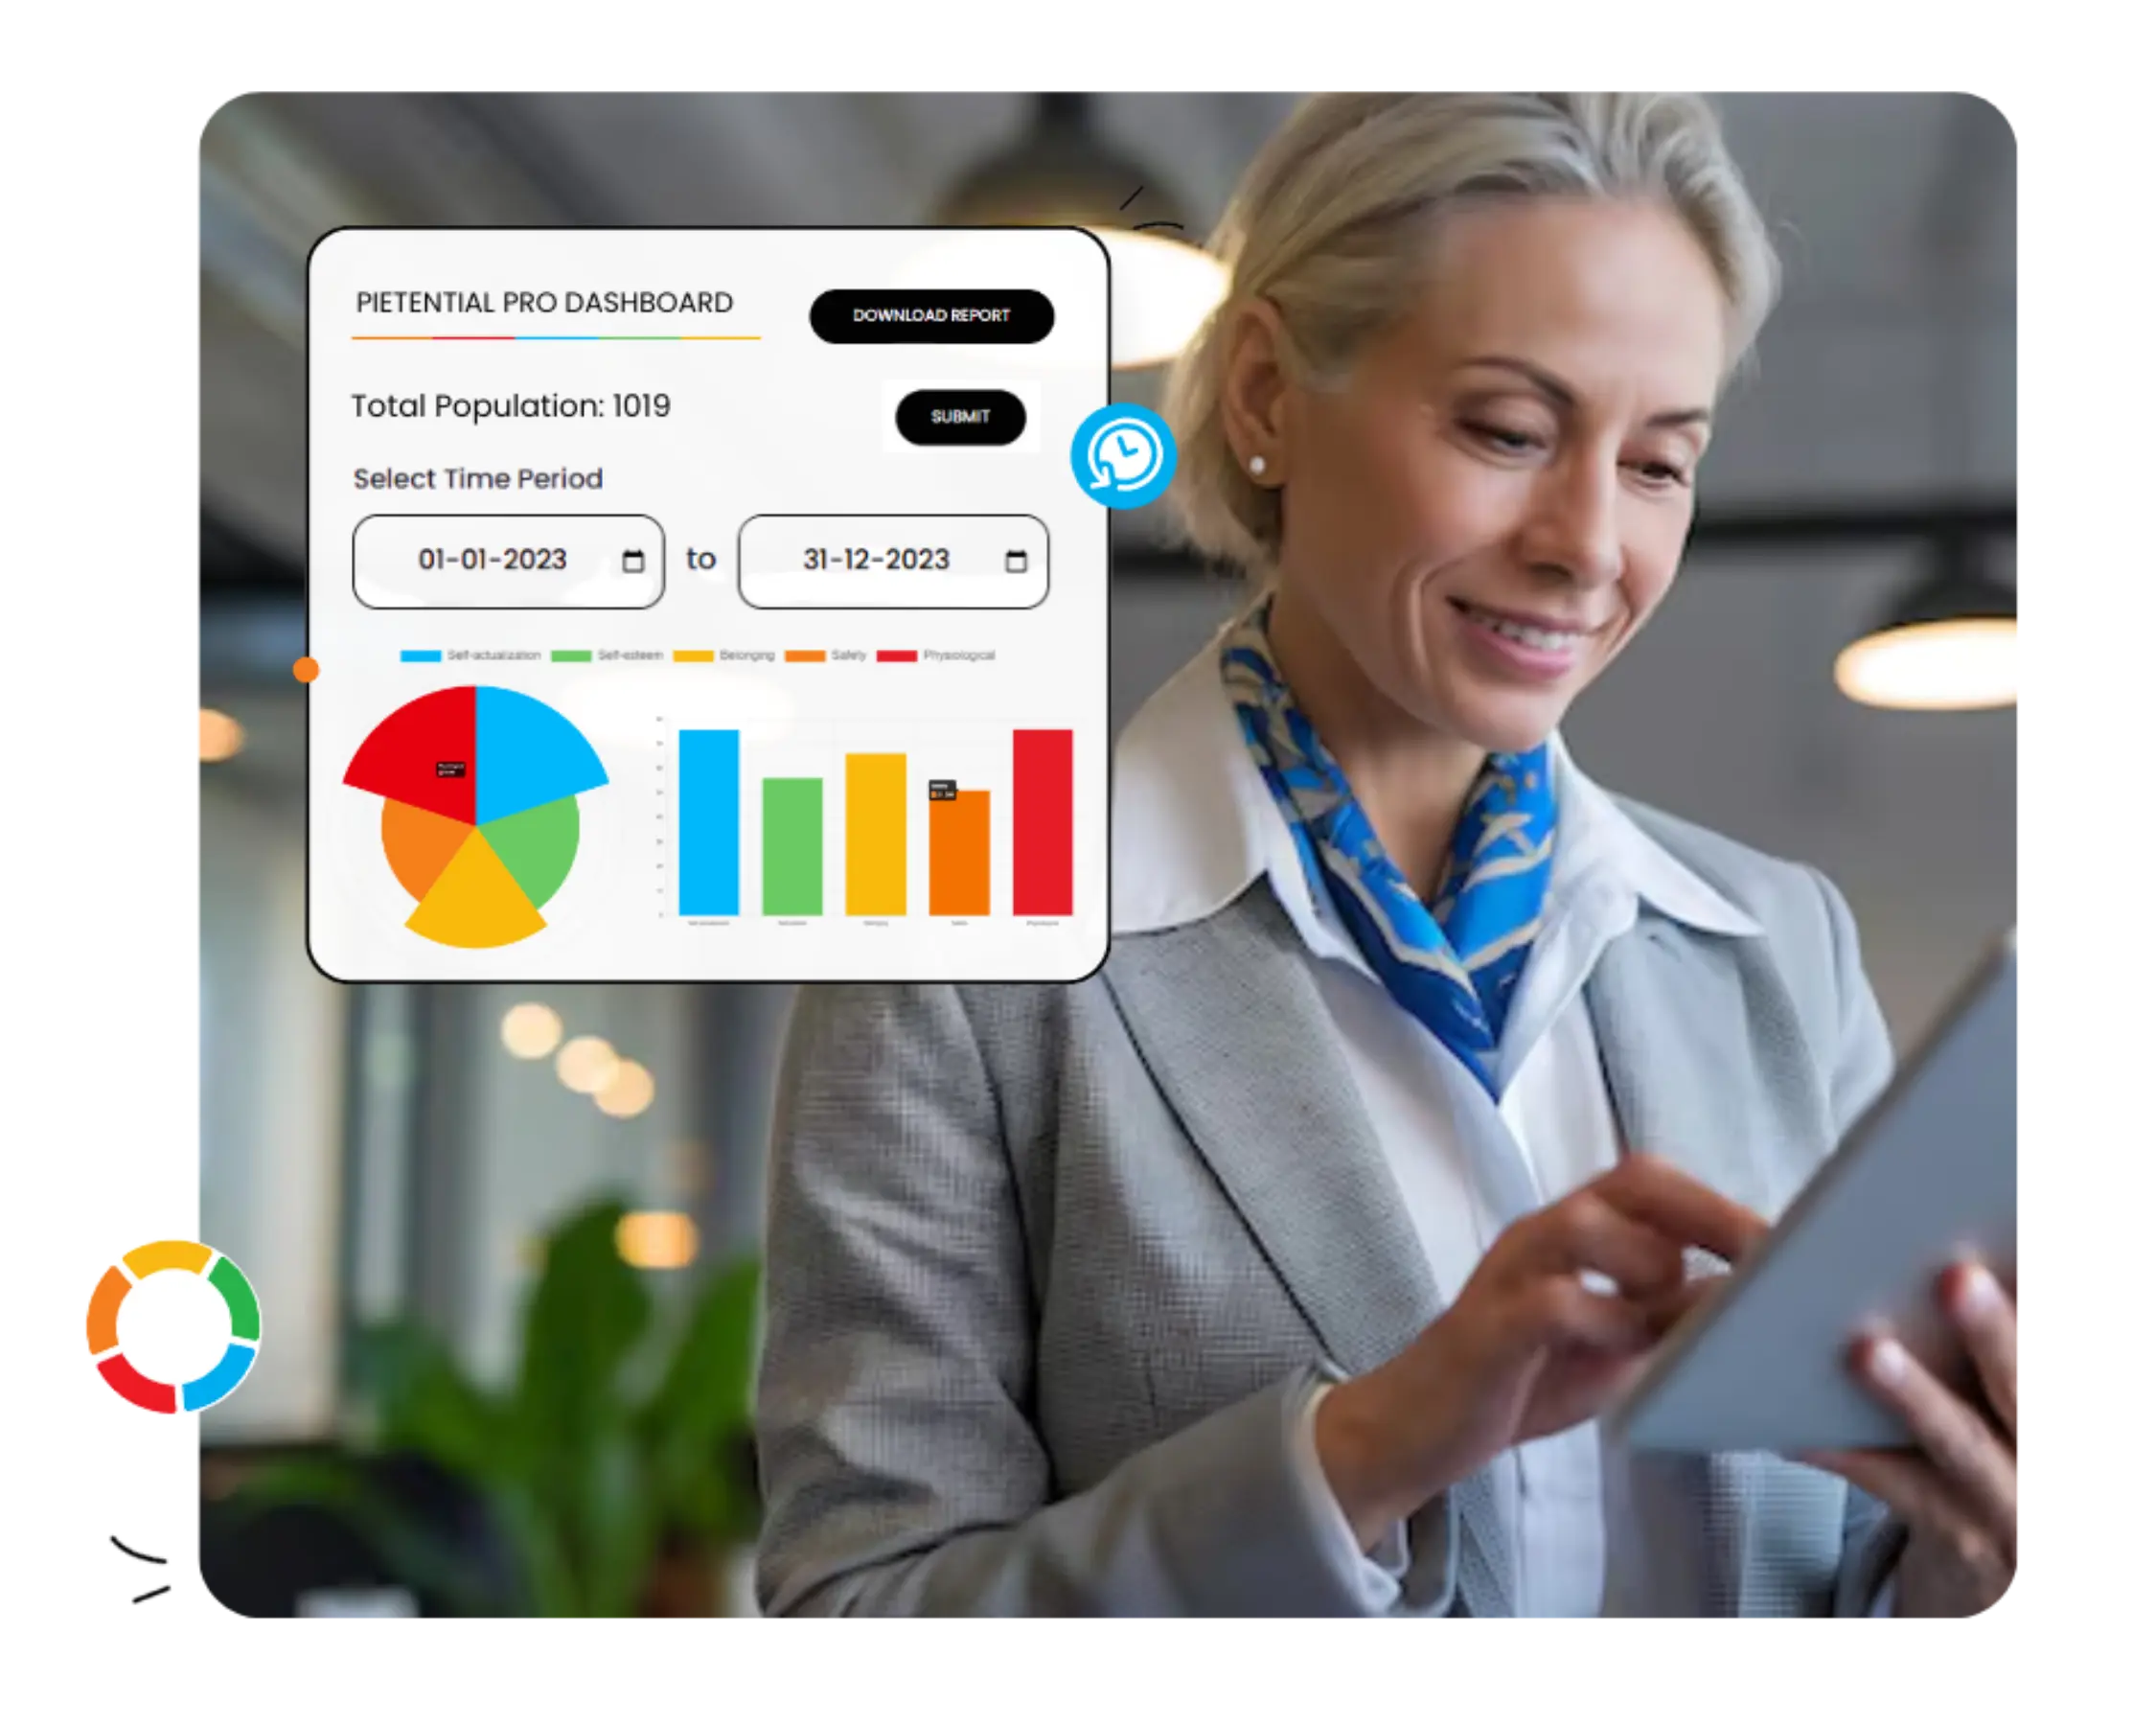
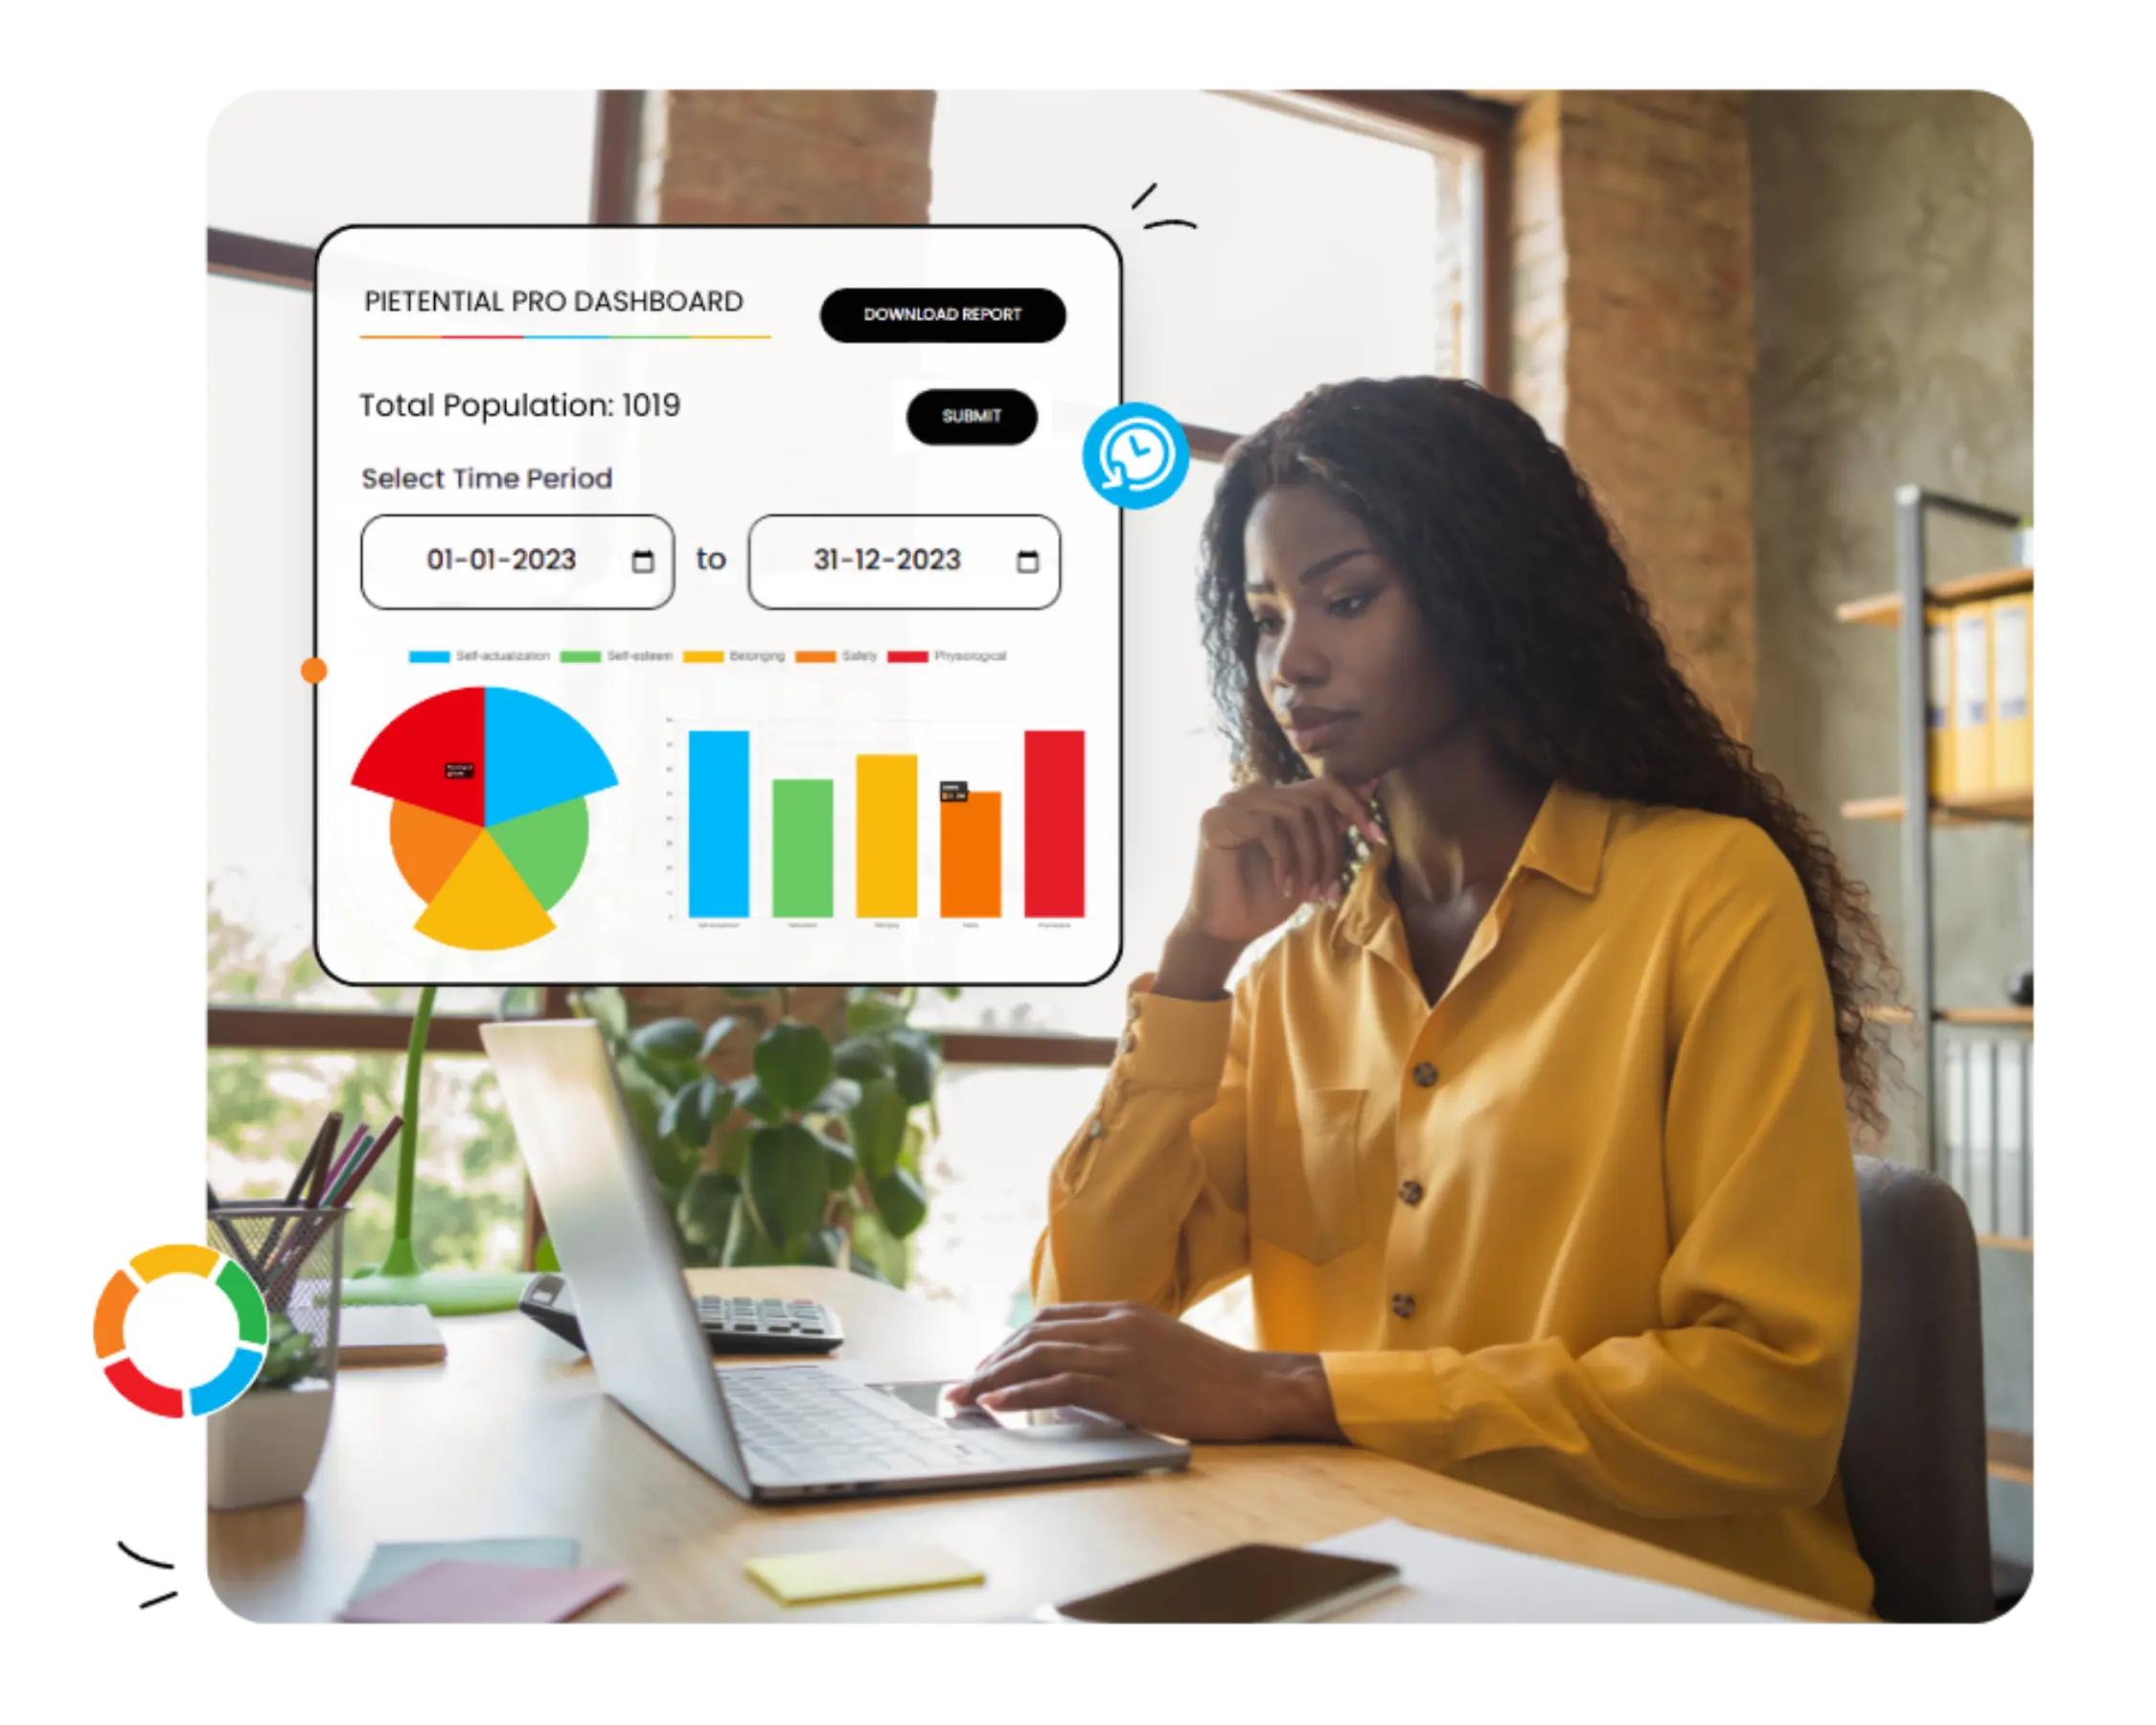
The Life Balance & Population Wellbeing
Realization System
Pietential provides your organization with an Administrative Dashboard displaying aggregated (and anonymized unless shared by the User) comparative data visualizations of the emotional wellbeing of the different segments of the populations you lead and serve.
We created it by reverse-engineering Maslow's Hierarchy of Needs into an online survey. It lets you Visualize, Analyze, Realize, and Actualize your state of being and growth potential, and tracks your personal development progress while offering observations, recommendations, and mindfulness exercises to foster your personal growth.
And it’s Free for Individual Subscribers!
Self Actualization
Self-Esteem and Contribution
Love and Belonging
Safety Needs
Physiological Needs
Pietential provides a window into the Physiological, Safety, Love and Belonging, Esteem, and Self-actualization levels needs of your population.
Survey scores taken through the Pietential tool are rendered in easy-to-read statistical charts; admins can compare data across desired time periods and population demographics.
Observations, recommendations, and personal growth-hacking exercises are offered instantly in order to enable users to access their full growth potential.
Users can log back in at any time and track their personal growth progress. Admins can track the progress of their populations.
Pietential has a diagnostic system to detect a drop in employee wellbeing, alerting admins to take action and offer support.
Prove the efficacy of your DEI strategies, and attract the right talent. With Pietential, you can showcase your organization's positive culture.
Individual users' data is anonymized and reported only in aggregate charts. Users can choose to share, at their own discretion, the individual information with admins.
Based on your population, you can choose the Pietential plan that best suits you and your organization.
ENTERPRISE
Get comparative analytics on employee demographics and DEI initiatives.
BUSINESS
Monitor employee wellbeing and offer support in their growth and DEI initiatives.
Advisor
Build trust more quickly and stay connected to the client's wellbeing.
ngo
Measure the good you do for the populations you serve.
ADVISOR
Build Trust More Quickly and Stay
Connected to Clients
Population Average: This feature lets you visualize the wellbeing of your entire population for the selected time period.
Invite New User(s): You can invite new users directly by either manually adding their emails or uploading CSV/XML files.
Your Cohorts: All cohorts in your population can be viewed here, along with the present population of the cohorts.
Individual Scores: You can visualize the wellbeing of any individual for the selected time period and track their progress.
Create Cohort: With this feature, you can create a group with desired demographic(s) from your existing database.
Create Cohort: On clicking Create New Cohort, you will be asked to name the cohort and then choose the combination of demographics.
Create Cohort: Now, you can select one or more categories for each demography, as required.
Create Cohort: Once you complete the Create New Cohort process, you will be presented with the total matches found in the database.
Cohort Average: Visualize the wellbeing of any cohort for the selected time period and track their progress.
Adjust Threshold: You can select a threshold at a given score range to set an alert for you to check in with that individual/cohort/entire population.
Adjust Threshold: Simply select the scope, the need, and the score range, and it will ensure that you receive a notification if the selected scope's wellbeing drops below the selected threshold.
Adjust Threshold: Once you have selected the threshold, you can edit, delete, or add another threshold to your present scope.
Adjust Threshold: To add another threshold, repeat the process, select the need and score range, and hit submit.
Adjust Threshold: Since every human has five core needs, you can set a maximum of five thresholds in any scope, one in each category.
Comparative Analysis: With this feature, you can compare wellbeing of two individuals, demographies, or existing cohorts.
Comparative Analysis: Simply select the scope, time period, and the two entities you want to compare, and it fetches the wellbeing of both entities for you to compare.
ADVISOR
Build Trust More Quickly and Stay
Connected to Clients
Pietential ADVISOR is for people who serve as a trusted advisor to their clients
(and prospective
clients).
Life coaches, counselors, therapists, financial advisors, nutritionist and personal trainers; CEO Mastermind
group facilitators and business consultants; CVAs, exit planners, business brokers, and other types of
professional advisors can use it to monitor the well being of the people they advise, and to get (and stay )
more deeply connected to them.
And, when used as a business development tool, it helps you build trust more quickly by getting
into a conversation with prospective clients about life balance, and what's important to them.
ENTERPRISE
Get Comparative Analytics on
Employee Demographics
Population Average: This feature lets you visualize the wellbeing of your entire population for the selected time period.
Invite New User(s): You can invite new users directly by either manually adding their emails or uploading CSV/XML files.
Your Cohorts: All cohorts in your population can be viewed here, along with their present population.
Individual Scores: You can visualize the wellbeing of any individual (who has opted to share their direct scores) for the selected time period and track their progress.
Create Cohort: With the Create Cohort feature, you can create a group with desired demographic(s) from your existing database.
Create Cohort: On clicking Create New Cohort, you will be asked to name the cohort and then choose the combination of demographics.
Create Cohort: Now, you can select one or more categories for each demography, as required.
Create Cohort: Once you complete the Create New Cohort process, you will be presented with the total matches found in the database.
Cohort Average: Visualize the wellbeing of any cohort for the selected time period and track their progress.
Adjust Threshold: You can select a threshold at a given score range to set an alert for you to check in with that individual/cohort/entire population.
Adjust Threshold: Simply select the scope, the need, and the score range, and it will ensure that you receive a notification if the wellbeing drops below the selected threshold.
Adjust Threshold: Once you have selected the threshold, you can edit, delete, or add another threshold to your present scope.
Adjust Threshold: To add another threshold, repeat the process, select the need and score range, and hit submit.
Adjust Threshold: Since every human has five core needs, you can set a maximum of five thresholds in any scope, one in each category.
Comparative Analysis: With this feature, you can compare the wellbeing of two individuals, demographies, or existing cohorts.
Comparative Analysis: Simply select the scope, time period, and the two entities you want to compare, and it fetches the wellbeing of both entities for you to compare.
Comparative Analysis: You can select the scope as a Temporary Customized Cohort and compare the combination of demographics.
ENTERPRISE
Get Comparative Analytics on
Employee Demographics
The Pietential ENTERPRISE population wellbeing monitoring platform is for
organizations with large
(often de-centralized) populations, like national and global corporations, School Systems; Colleges,
Universities and University Systems; large NPOs and NGOs; and Local, State and Federal Agencies who want to be
able to to visualize, quantify and better understand their population wellbeing, in order that they can take
steps to improve it.
Pietential ENTERPRISE affords every member of the organization access to Pietential and the ability to
visualize their own personal well being. And, through a custom API integration it gives the organization's
leadership the ability to visualize the wellbeing of the entire organization in aggregate, or to view any
number of comparative visualizations segmented in any manner in which the client's HR database is already
architected.
BUSINESS
Monitor Employee Wellbeing and
DEI Initiatives
Population Average: This feature lets you visualize the wellbeing of your entire population for the selected time period.
Invite New User(s): You can invite new users directly by either manually adding their emails or uploading CSV/XML files.
Your Cohorts: All cohorts in your population can be viewed here, along with their present population.
Individual Scores: You can visualize the wellbeing of any individual (who has opted to share their direct scores) for the selected time period and track their progress.
Create Cohort: With the Create Cohort feature, you can create a group with desired demographic(s) from your existing database.
Create Cohort: On clicking Create New Cohort, you will be asked to name the cohort and then choose the combination of demographics.
Create Cohort: Now, you can select one or more categories for each demography, as required.
Create Cohort: Once you complete the Create New Cohort process, you will be presented with the total matches found in the database.
Cohort Average: Visualize the wellbeing of any cohort for the selected time period and track their progress.
Adjust Threshold: You can select a threshold at a given score range to set an alert for you to check in with that individual/cohort/entire population.
Adjust Threshold: Simply select the scope, the need, and the score range, and it will ensure that you receive a notification if the wellbeing drops below the selected threshold.
Adjust Threshold: Once you have selected the threshold, you can edit, delete, or add another threshold to your present scope.
Adjust Threshold: To add another threshold, repeat the process, select the need and score range, and hit submit.
Adjust Threshold: Since every human has five core needs, you can set a maximum of five thresholds in any scope, one in each category.
Comparative Analysis: With this feature, you can compare the wellbeing of two individuals, demographies, or existing cohorts.
Comparative Analysis: Simply select the scope, time period, and the two entities you want to compare, and it fetches the wellbeing of both entities for you to compare.
BUSINESS
Monitor Employee Wellbeing and
DEI Initiatives
The Pietential BUSINESS Platform allows owners of small and medium businesses,
and directors of
nonprofit organizations to offer Pietential to their employees in order to support employee wellbeing on an
individual basis, and better understand employee population wellbeing on an aggregate basis.
Pietential BUSINESS offers a customizable front-end employee survey which allows organizational
leadership to visualize and analyze employee wellbeing by location, job title, age, or any other demographic
factors that their human resource department keeps track of.
While system settings allow company employees to choose whether or not share their individual Pietential
status with their employer's HR Department, the ownership, and the company receives aggregate visualizations,
showing the well being of the employee population as charts without revealing individual employees’ status.
NGO
Measure the Good you do for the
Populations you Serve
Population Average: This feature lets you visualize the wellbeing of your entire population for the selected time period.
Invite New User(s): You can invite new users directly by either manually adding their emails or uploading CSV/XML files.
Your Communities: All Communities in your population can be viewed here, along with their present population.
Individual Scores: You can visualize the wellbeing of any individual for the selected time period and track their progress.
Create Community: With this feature, you can create a group with desired demographic(s) from your existing database.
Create Community: On clicking Create New Community, you will be asked to name the community and then choose the combination of demographics.
Create Community: Now, you can select one or more categories for each demography, as required.
Create Community: Once you complete the Create New Community process, you will be presented with the total matches found in the database.
Community Averages: Visualize the wellbeing of any community for the selected time period and track their progress.
Adjust Threshold: You can select a threshold at a given score range to set an alert for you to check in with that individual/community/entire population.
Adjust Threshold: Simply select the scope, the need, and the score range, and it will ensure that you receive a notification if the wellbeing drops below the selected threshold.
Adjust Threshold: Once you have selected the threshold, you can edit, delete, or add another threshold to your present scope.
Adjust Threshold: To add another threshold, repeat the process, select the need and score range, and hit submit.
Adjust Threshold: Since every human has five core needs, you can set a maximum of five thresholds in any scope, one in each category.
Comparative Analysis: With this feature, you can compare the wellbeing of two individuals, demographies, or existing cohorts.
Comparative Analysis: Simply select the scope, time period, and the two entities you want to compare, and it fetches the wellbeing of both entities for you to compare.
NGO
Measure the Good you do for the
Populations you Serve
The Pietential NGO Platform allows directors and staff of Non-governmental
Organizations the ability
to offer Pietential to their populations in order to measure and monitor wellbeing on an individual basis, and
aggregate basis.
It offers a customizable front-end employee survey which allows the administrator to visualize and analyze
individual and community wellbeing by age, race, location, gender, caste, education level, or any other
demographic factors that the NGO would like to monitor.
Pietential NGO is a wellbeing visualization and monitoring tool; therefore, with the consent of the
individual community members, through acceptance of the Subscriber Terms of Use, the client's information is
automatically shared with the NGO.
Our Process
Pietential Admin services are customized based on your organization and the populations you lead and serve. So, the query form is designed to help us better understand your requirements.
Once we receive your request, our team will schedule a call with you. It’s important for us to understand your potential use case for the Pietential platform so that we can help you be successful with it.
After both parties agree and the terms are signed, we will invoice you for the payment. Shortly after, you will receive a link to register your Admin account. You can always book onboarding support calls if needed.
Every organization and population is different; based on your choices, we will help you build a customized demographic profile for your population. These demographics will later be used to draw a comparative analysis.
Once you have set up your Admin account, you will receive a promo code that you can share with your population so they can use the platform.
Log in with your active Admin Id and start using your customized Admin dashboard. If you need any support, you can book a Zoom call with us.
You can invite new users into your population by uploading contacts manually or via XML/CSV files, or you can use our custom API. The “Population Average” feature lets you monitor and track your entire population’s wellbeing.
You can create different segmented cohorts within your population. The “Comparative Analysis” feature lets you compare and analyze the wellbeing of different cohorts, demographics, and individuals.
Fill in your details, and you are ready to experience Pietential. If you have a promo code, you will receive an additional form regarding the demographic details requested by your Admin.
Complete a 5-7 minutes survey to evaluate your current state of life balance and wellbeing. Be authentic; it’s not a test. There are no right or wrong answers to these questions.
Once you answer all the questions, you will receive a visualization of your life balance in the form of a pie chart and bar graph.
Based on your current wellbeing scores, Pietential provides instant observations, recommendations, and personal growth-hacking exercises to help you take your wellbeing to the next level.
You can retake the Pietential survey as many times as you want. Simply log in and click on retake the survey. Once you have taken survey more than once, you will see a line graph of your life balance which will help you track your progress.
Pietential is on a Mission to bring its Life Balance Realization System to the world. To achieve that, our Individual Subscription is completely free!
Contact us